GO2 LIFE
GO2 PHYSIOLOGICAL PERFORMANCE IMPACTS
The graphs below illustrate the physiological performance impacts of GO2 observed in a trial that compares outcomes using GO2 and a placebo. The subject was a 23 year old male elite triathlete. 15ml of GO2 was taken orally each morning for 7 days prior to testing. Similarly, 15 ml of a dummy placebo was taken orally each morning for 7 days prior to a comparable test.
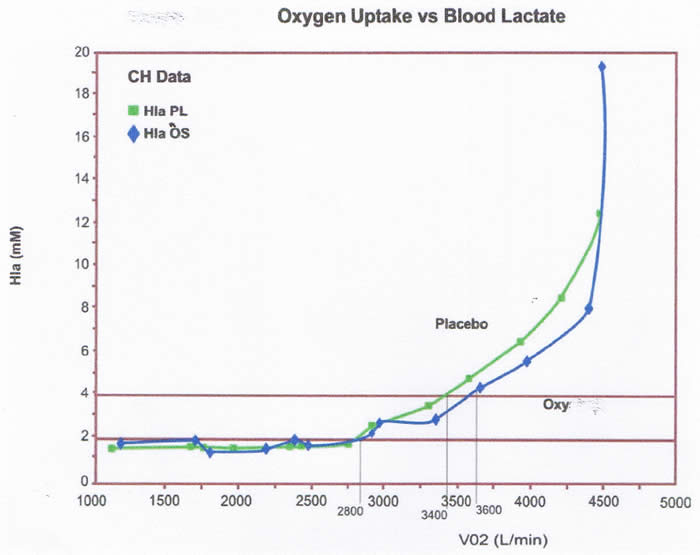
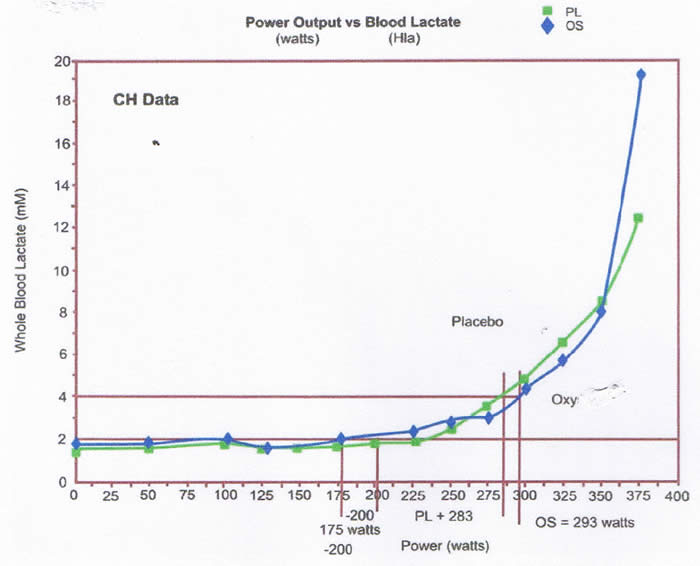
The research data shows that the athlete turned over more oxygen and provided a higher workrate of approximately 6.1% at the anaerobic threshold (4 mmol of whole blood lactate) during the bicycle ergometer work trial following the use of GO2. (The 4 mmol of blood lactate is the point beyond which fatigue begins to shutdown physical exertion).
The first graph compares oxygen uptake against blood lactate, with clearly a significant increase in the level of oxygen metabolized by 6.1%.

The second graph compares power output against blood lactate and shows an increase in power output at the anaerobic threshold of 3.5%

Note: These observations relate to one athlete only and are intended to be indicative of outcomes that may be achieved through use of GO2. Individual outcomes will be influenced by factors such as a person’s age, size, fitness, health, environment and the demands of the sport or activity being performed.

